Los Angeles crime trends, 2020–2023
Crime in Los Angeles has shifted notably over the past four years — falling during the height of the COVID-19 pandemic, then rising as the city reopened and activity resumed.
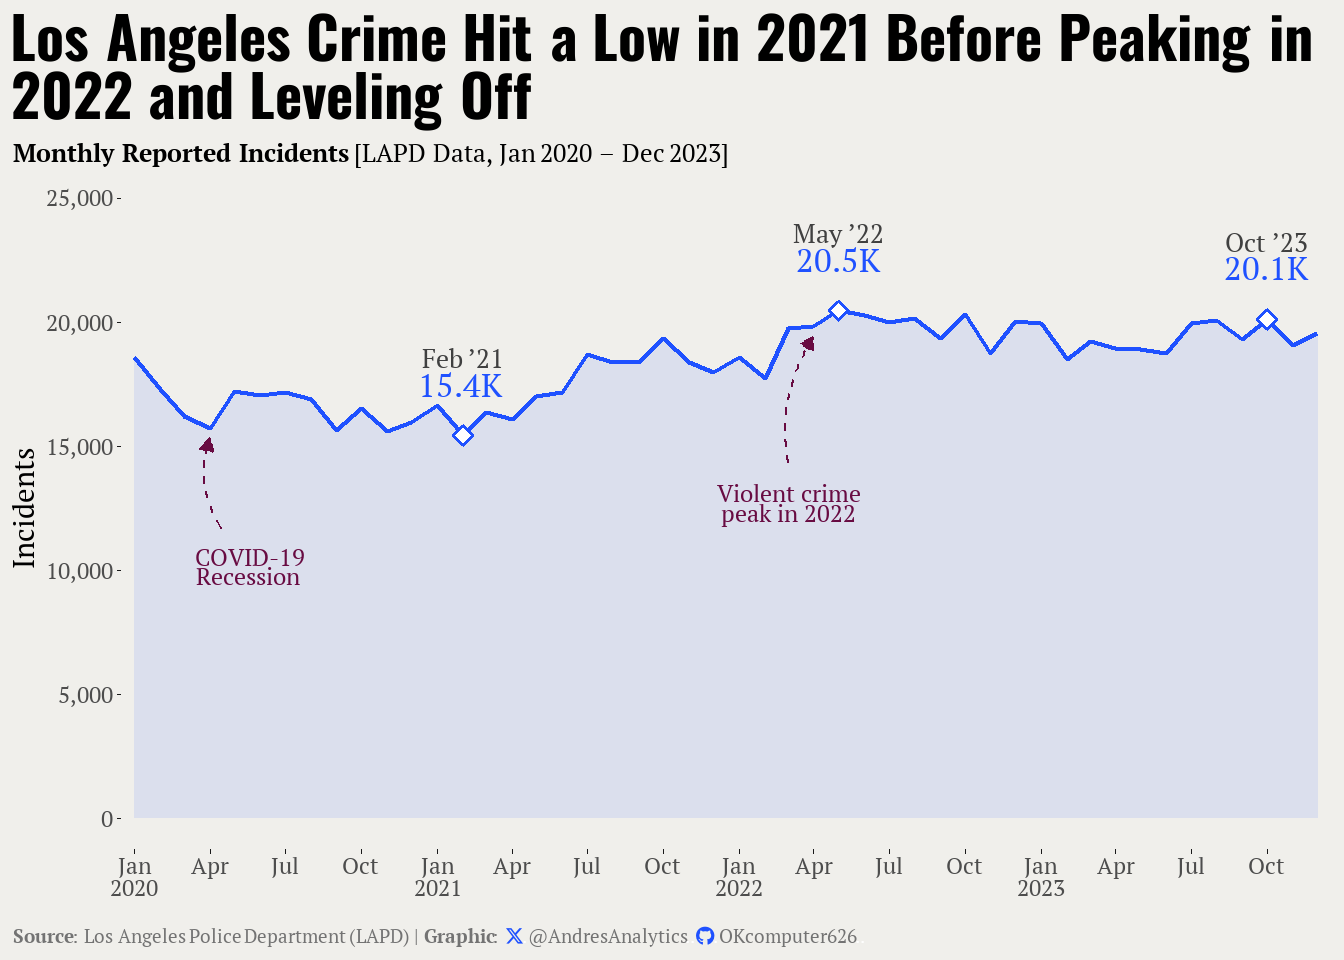
According to official data from the Los Angeles Police Department (LAPD) Open Data Portal, monthly reported incidents reached a four-year low in early 2021 before peaking in mid-2022 and stabilizing at roughly 20,000 incidents per month through the end of 2023.
The pandemic dip
During the height of the COVID-19 recession, citywide activity slowed to a crawl.
With fewer cars on the road and nightlife shut down, Los Angeles logged roughly 15.4 K incidents in February 2021, the lowest monthly total in recent history.
That low point reflected the unusual conditions of lockdown life — not necessarily a long-term drop in crime, but a pause caused by reduced movement and opportunity.
The rebound and plateau
Once restrictions eased in 2021, reported crime began to climb again.
By May 2022, incidents reached 20.5 K, marking the city’s highest point in more than two years.
Since then, monthly totals have stayed near that mark, closing October 2023 at 20.1 K incidents — slightly below the 2022 peak but well above pandemic lows.
This plateau suggests Los Angeles may have reached a new post-pandemic baseline.
What might explain the shift?
Several factors likely contributed:
-
Mobility and nightlife returned — more people outside means more interactions (and more opportunities for crime).
-
Economic pressure — inflation and job instability often correlate with upticks in certain offenses.
- Policing adjustments — resource shifts during and after the pandemic may have influenced reporting and enforcement patterns.
Still, the city’s overall trend is stable, not sharply rising — the 2022 jump looks more like a correction than a new surge.
Vehicle theft leads all reported crimes in L.A.
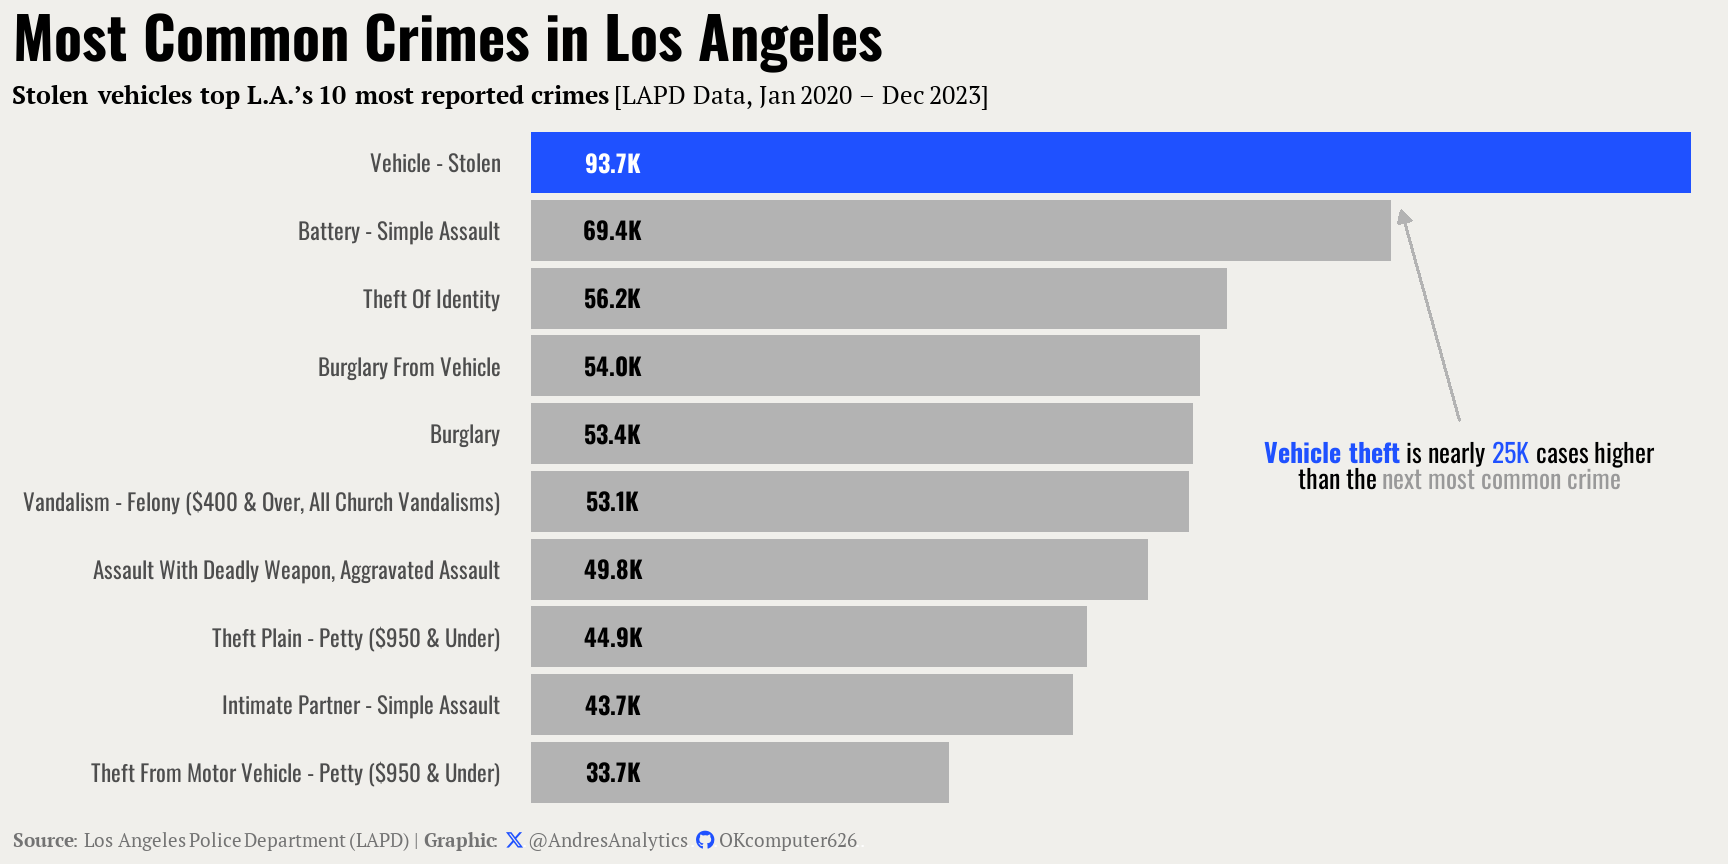
Over the past four years, vehicle theft has emerged as Los Angeles’ most reported crime — far surpassing every other offense.
According to LAPD data from 2020 through 2023, stolen vehicles accounted for more than 93,000 cases, nearly 25,000 higher than the next most common category: simple assault.
Recent coverage from KTLA News notes that vehicle thefts may be starting to decline statewide, but that specific models — especially Kia and Hyundai vehicles — remain the biggest targets for thieves.
That pattern mirrors what’s been observed locally in Los Angeles through 2023, even as total thefts begin to stabilize.
Why car theft remains elevated
-
Targeted models: According to KTLA, Kia and Hyundai vehicles without modern anti-theft systems have been disproportionately stolen across California.
-
Economic factors: Higher used-car values during the pandemic made vehicle theft more lucrative.
-
Social trends: Viral videos showing how to start certain cars without keys further amplified the issue.
- Preventive action: LAPD and local agencies have distributed free steering wheel locks and VIN etching programs to reduce risk.
While the statewide numbers show early signs of decline, the long-term totals still place vehicle theft firmly at the top of L.A.’s crime list.
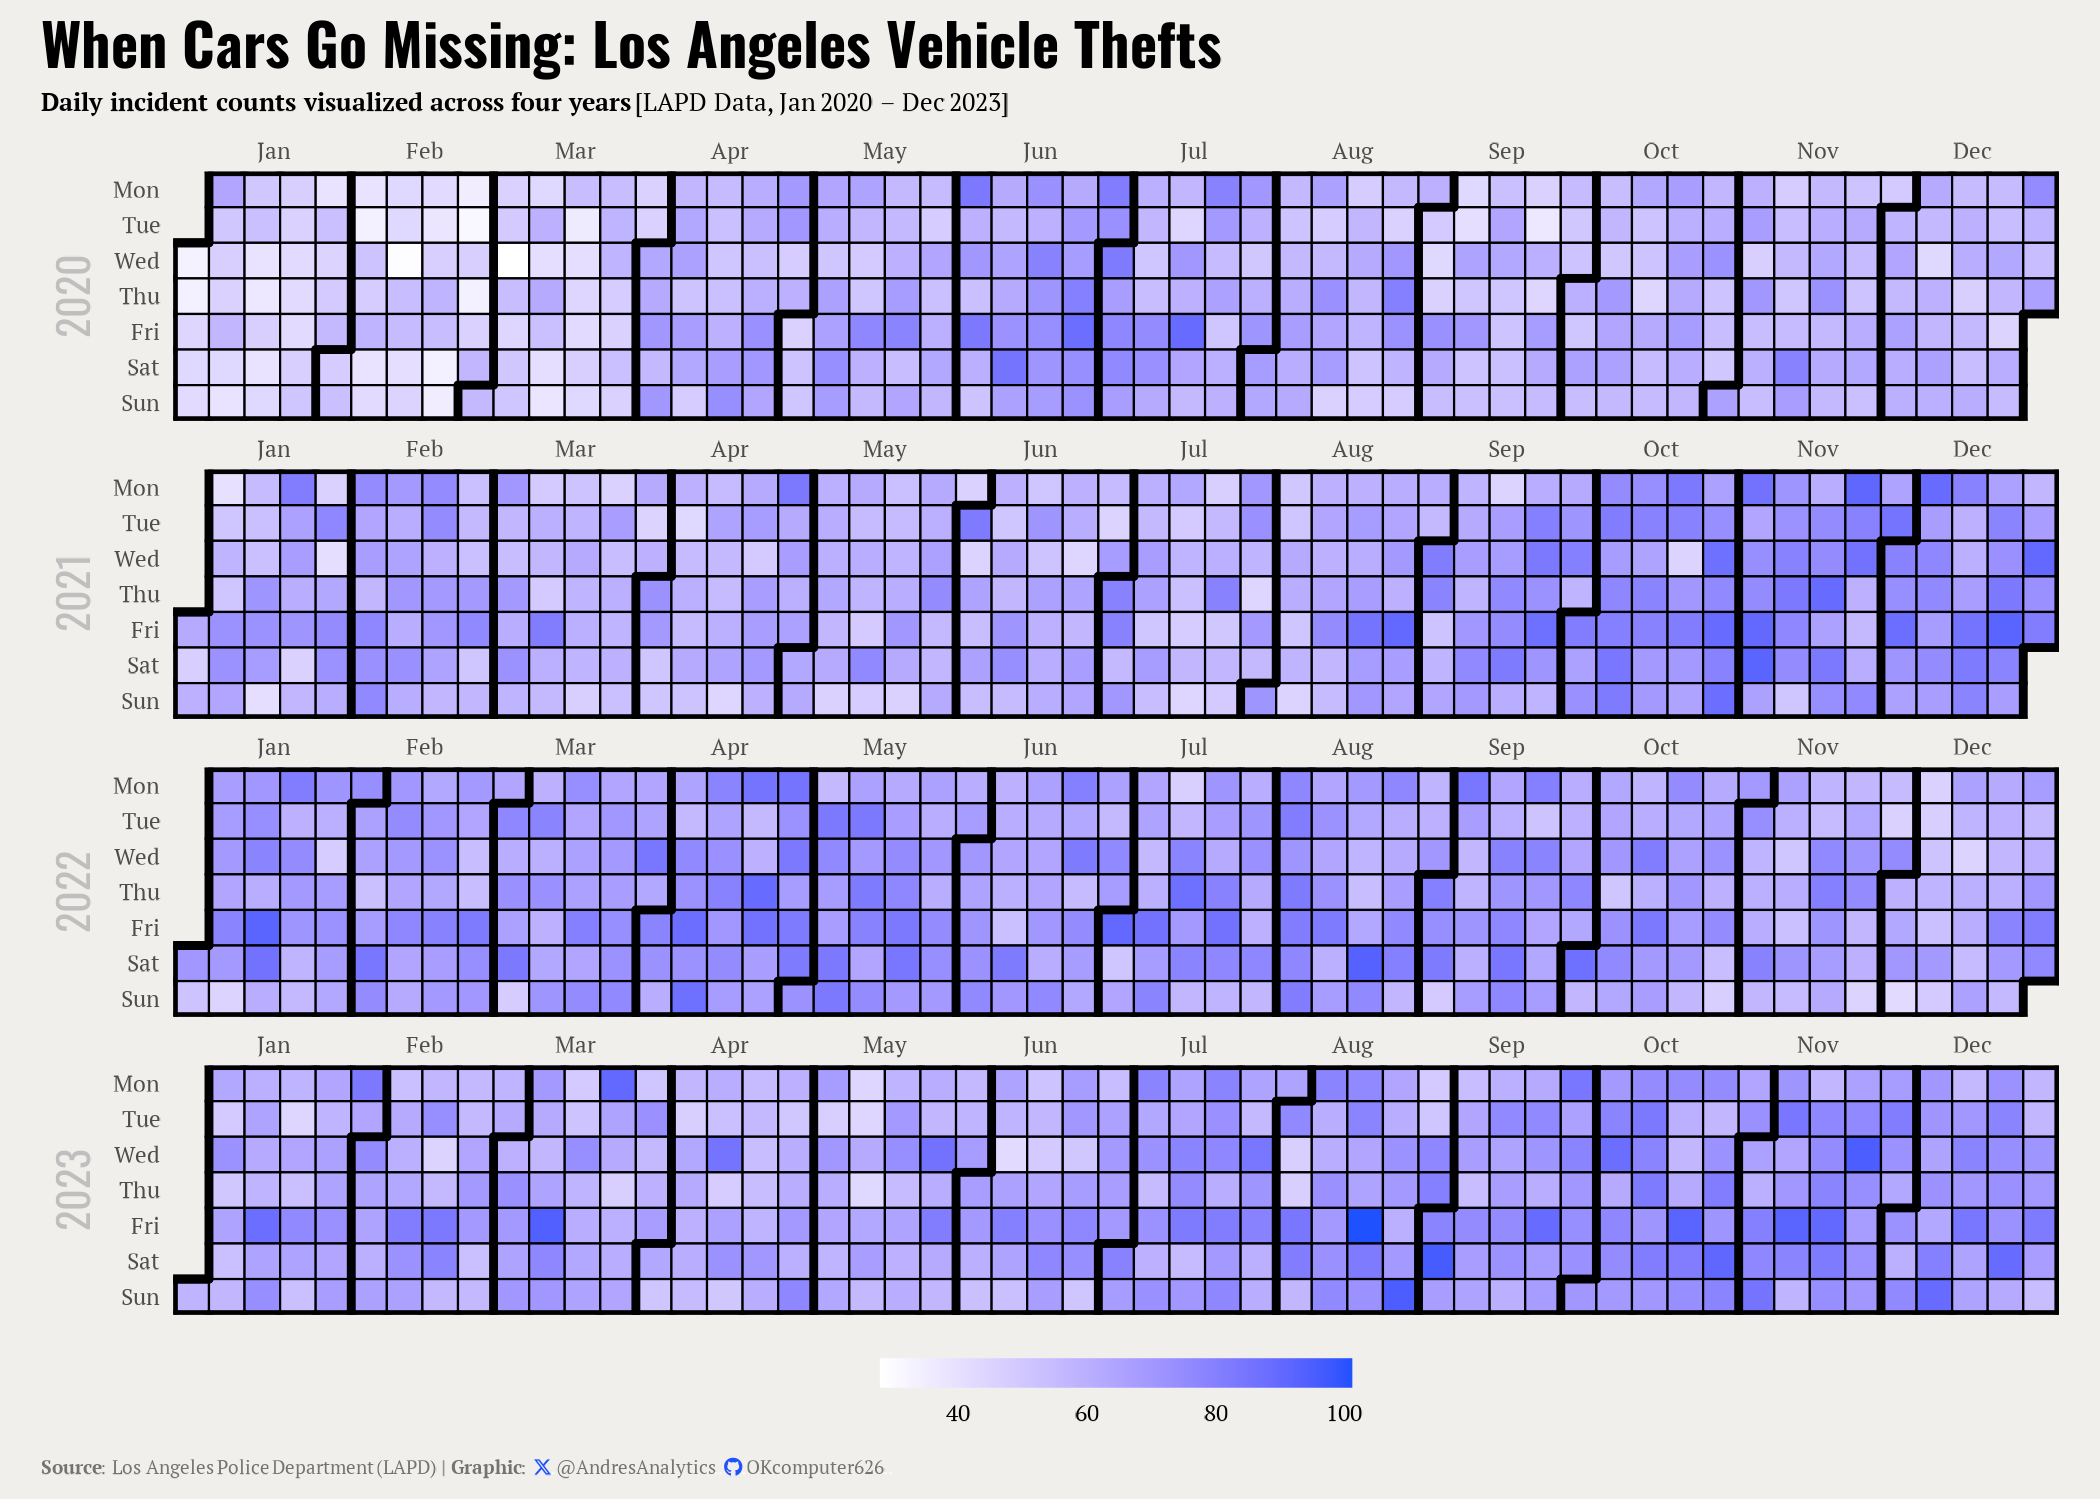
When are cars stolen most often?
Fridays and Saturdays lead vehicle thefts in 2023
Across Los Angeles, vehicle thefts don’t happen evenly throughout the week.
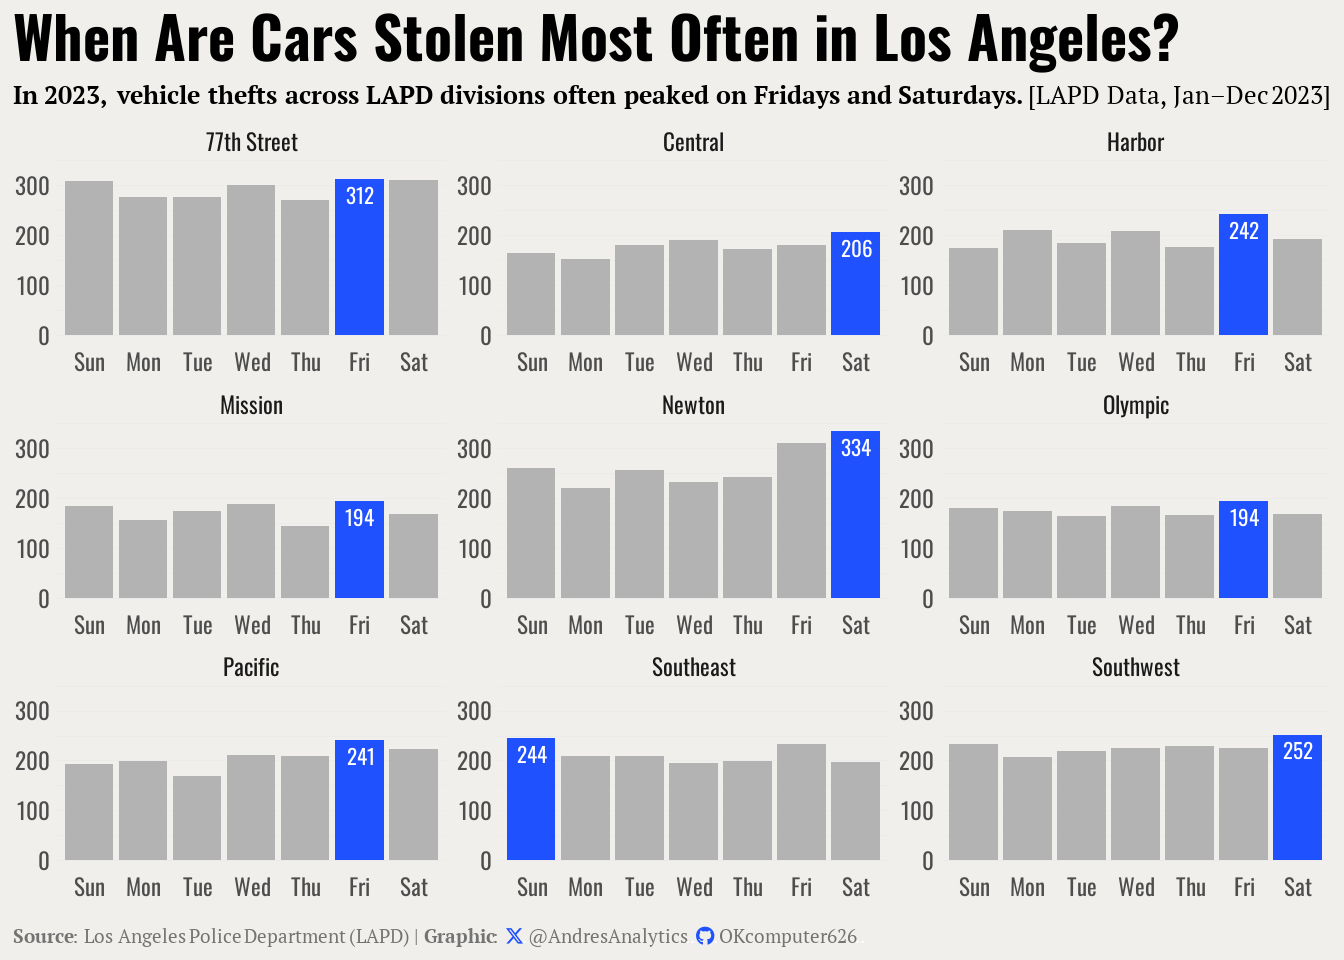
In 2023, LAPD data show clear late-week spikes — Fridays and Saturdays consistently ranked as the most common days for stolen vehicles across multiple divisions.
Division patterns
While theft occurs daily, some divisions stood out:
-
Newton Division recorded the highest single-day peak, with 334 Saturday thefts.
-
77th Street Division saw 312 thefts on Fridays.
-
Southwest and Southeast Divisions both reported around 250 thefts late in the week.
- Central and Olympic Divisions had smaller but steady weekend increases.
Overall, the pattern suggests more thefts as the week winds down — when cars are often parked longer in public or residential areas.
Why late-week thefts rise
-
More activity: Increased driving, nightlife, and weekend travel mean more vehicles left unattended in high-traffic areas.
-
Lower vigilance: People are less likely to notice or report suspicious activity during social hours or overnight weekends.
- Opportunity windows: Thieves may take advantage of vehicles left parked for multiple days.
The trend doesn’t imply weekends are inherently unsafe — rather, it highlights how routine behavior shapes crime opportunity.
What time of day do vehicle thefts happen?
Most vehicle thefts occur overnight and into the early morning hours
Following the patterns of when and where cars are stolen, the next layer of timing looks at hourly trends.
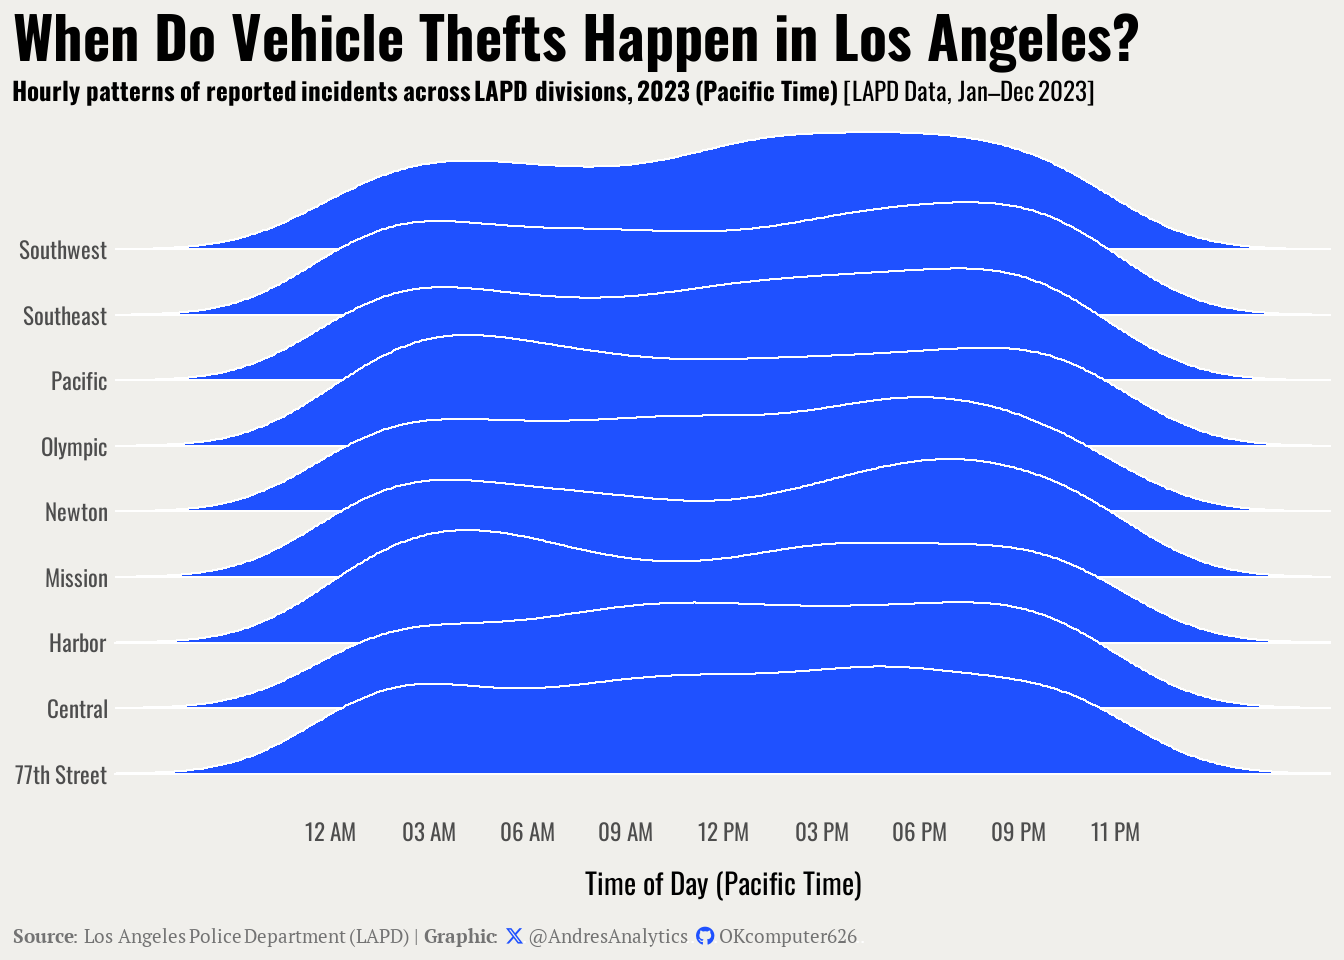
Across Los Angeles, most vehicle thefts in 2023 occurred during the late-night and early-morning hours, when visibility is lower and vehicles often sit unattended.
Overnight patterns across divisions
Theft timing is surprisingly consistent across divisions:
-
77th Street, Newton, and Southeast Divisions all show sharp peaks between midnight and 4 a.m.
-
Pacific and Olympic Divisions also follow the same overnight pattern, though with slightly more midday variation.
- Central and Harbor Divisions display broader curves, suggesting thefts occur more evenly throughout the day.
These overlapping shapes indicate that car thefts across Los Angeles tend to cluster under low-light conditions — likely reflecting both opportunity and reduced deterrence.
How have thefts changed over time?
Vehicle thefts surged after the pandemic before stabilizing in 2023
Over the past four years, Los Angeles has experienced a dramatic shift in vehicle theft trends.
Following a sharp decline during the COVID-19 recession in 2020, thefts rose steadily through 2021 and peaked in 2022 before beginning to level off in 2023.
Year-by-year overview
-
2020: Vehicle thefts dropped during the early pandemic months but began rising again by summer.
-
2021: The city recorded consistent increases, likely linked to economic reopening and supply shortages in used cars.
-
2022: The highest daily averages were observed, coinciding with a statewide spike in vehicle-related crime.
- 2023: Theft counts remained high but stabilized, showing the first signs of plateauing since pre-pandemic lows.
While totals have not returned to early 2020 levels, recent statewide reports suggest a gradual cooling — possibly reflecting greater awareness, targeted enforcement, and improved anti-theft measures.
What’s driving the long-term trend?
-
Economic conditions: Vehicle values rose sharply after 2020, incentivizing theft.
-
Social shifts: Stay-at-home periods reduced theft opportunity, but post-pandemic mobility reversed that trend.
-
Technology gaps: Certain Kia and Hyundai models remained key theft targets, as seen in both LAPD data and state reports.
- Preventive adaptation: Local initiatives such as steering wheel lock distributions and VIN etching programs are beginning to show results.
Overall, Los Angeles continues to see elevated theft levels, but the pace of increase has finally slowed.
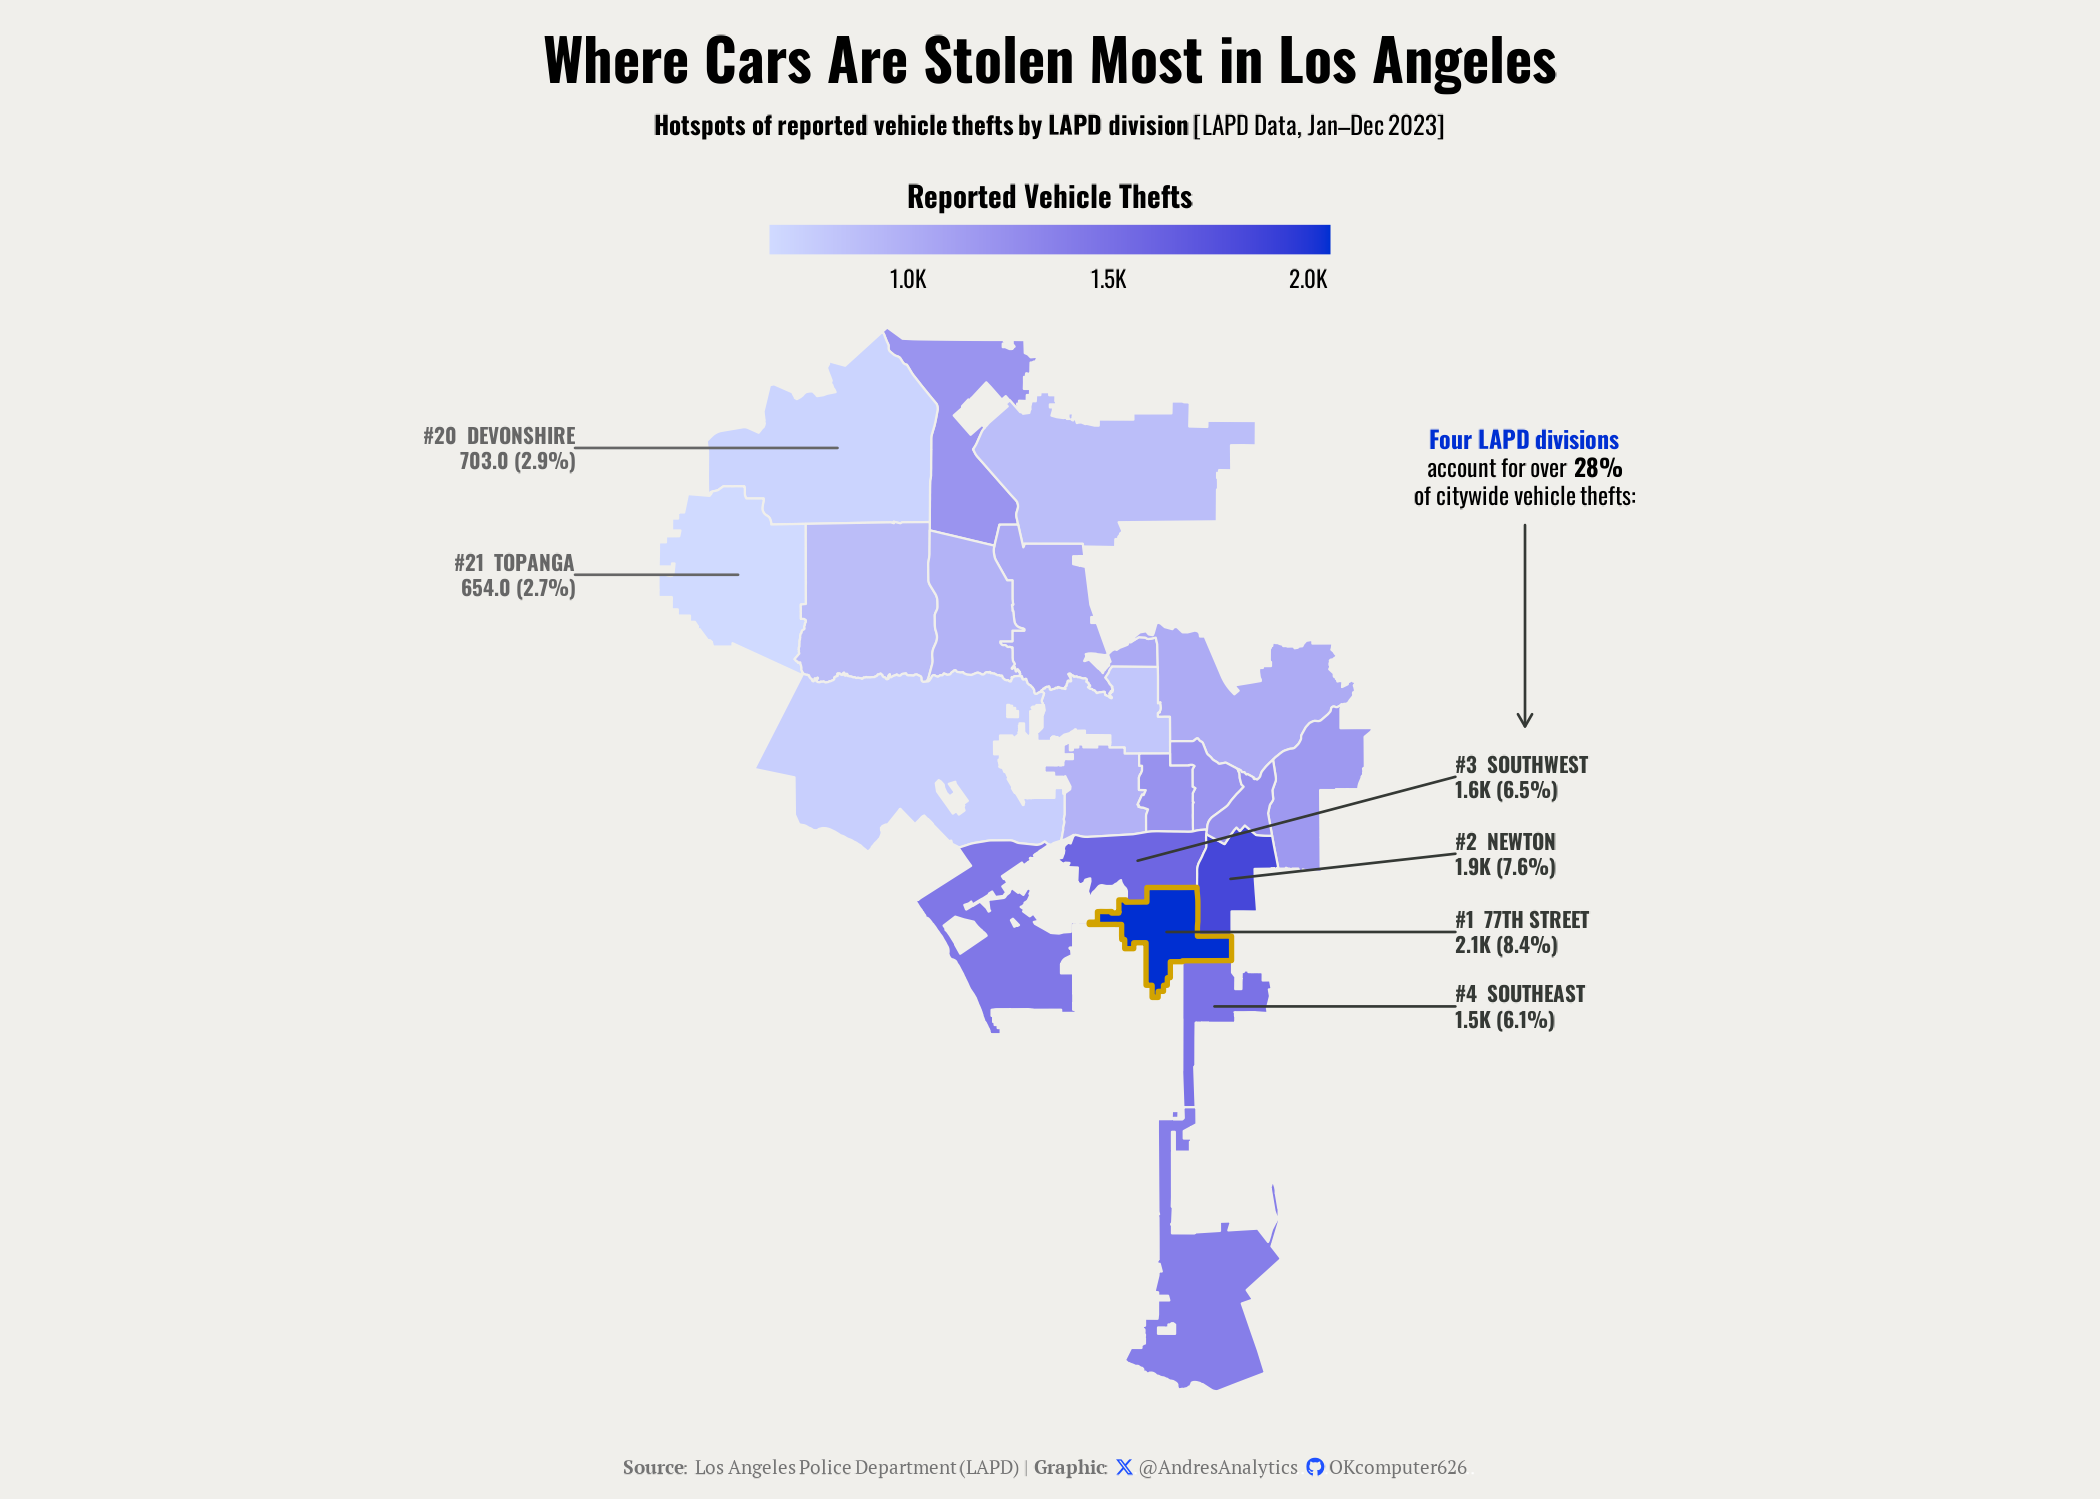
Where are cars stolen most often?
South Los Angeles remains the city’s car theft hotspot
After examining when vehicle thefts occur, this post turns to where they happen most often.
According to 2023 LAPD data, just four divisions in South Los Angeles — 77th Street, Newton, Southwest, and Southeast — accounted for over 28% of all reported vehicle thefts citywide.
Concentrated in South Los Angeles
-
77th Street Division led all areas with 2,100 thefts (8.4%), marking it as the city’s top hotspot.
-
Newton Division followed with 1,900 thefts (7.6%), maintaining its reputation as one of L.A.’s most active regions for vehicle-related crimes.
- Southwest (1,600 thefts, 6.5%) and Southeast (1,500 thefts, 6.1%) rounded out the top four.
These divisions sit in a densely populated section of the city with high vehicle density, numerous parking corridors, and major freeway access — all conditions that elevate risk.
Context behind the geography
-
Accessibility: Quick freeway entry points can make it easier for stolen vehicles to leave an area undetected.
-
Vehicle exposure: More street and apartment parking in these neighborhoods increases opportunity.
-
Economic and social patterns: Concentrated economic activity and mixed land use contribute to higher vehicle turnover.
- Preventive focus: LAPD and community groups have responded with targeted patrols and awareness campaigns in high-theft corridors.
Despite these ongoing efforts, the southern divisions continue to drive much of L.A.’s vehicle theft total each year.
Looking ahead
Future updates will track whether these same South L.A. divisions continue to dominate in 2024 and 2025 — or if theft patterns begin shifting north and west as prevention efforts take hold.
Sources:
- Los Angeles Police Department (LAPD) Open Data — Crime Data from 2020 to Present
-
KTLA News — Vehicle thefts decrease, but these are the biggest targets
- ABC7 — Los Angeles homicides reach highest level in 15 years
Graphics: @AndresAnalytics · GitHub: OKcomputer626
Note
Data Note: Analysis based on publicly available reports from the Los Angeles Police Department (LAPD) Open Data Portal; figures represent reported incidents and may be subject to reclassification or updates.
Citation
For attribution, please cite this work as:
Gonzalez, Andres. 2025. “How Crime in Los Angeles Changed from
2020 to 2023.” October 5, 2025. https://andresgonzalezstats.com/blog/blog_2025/Crime
in LA/Crime Analysis LA 2020-2023.html.