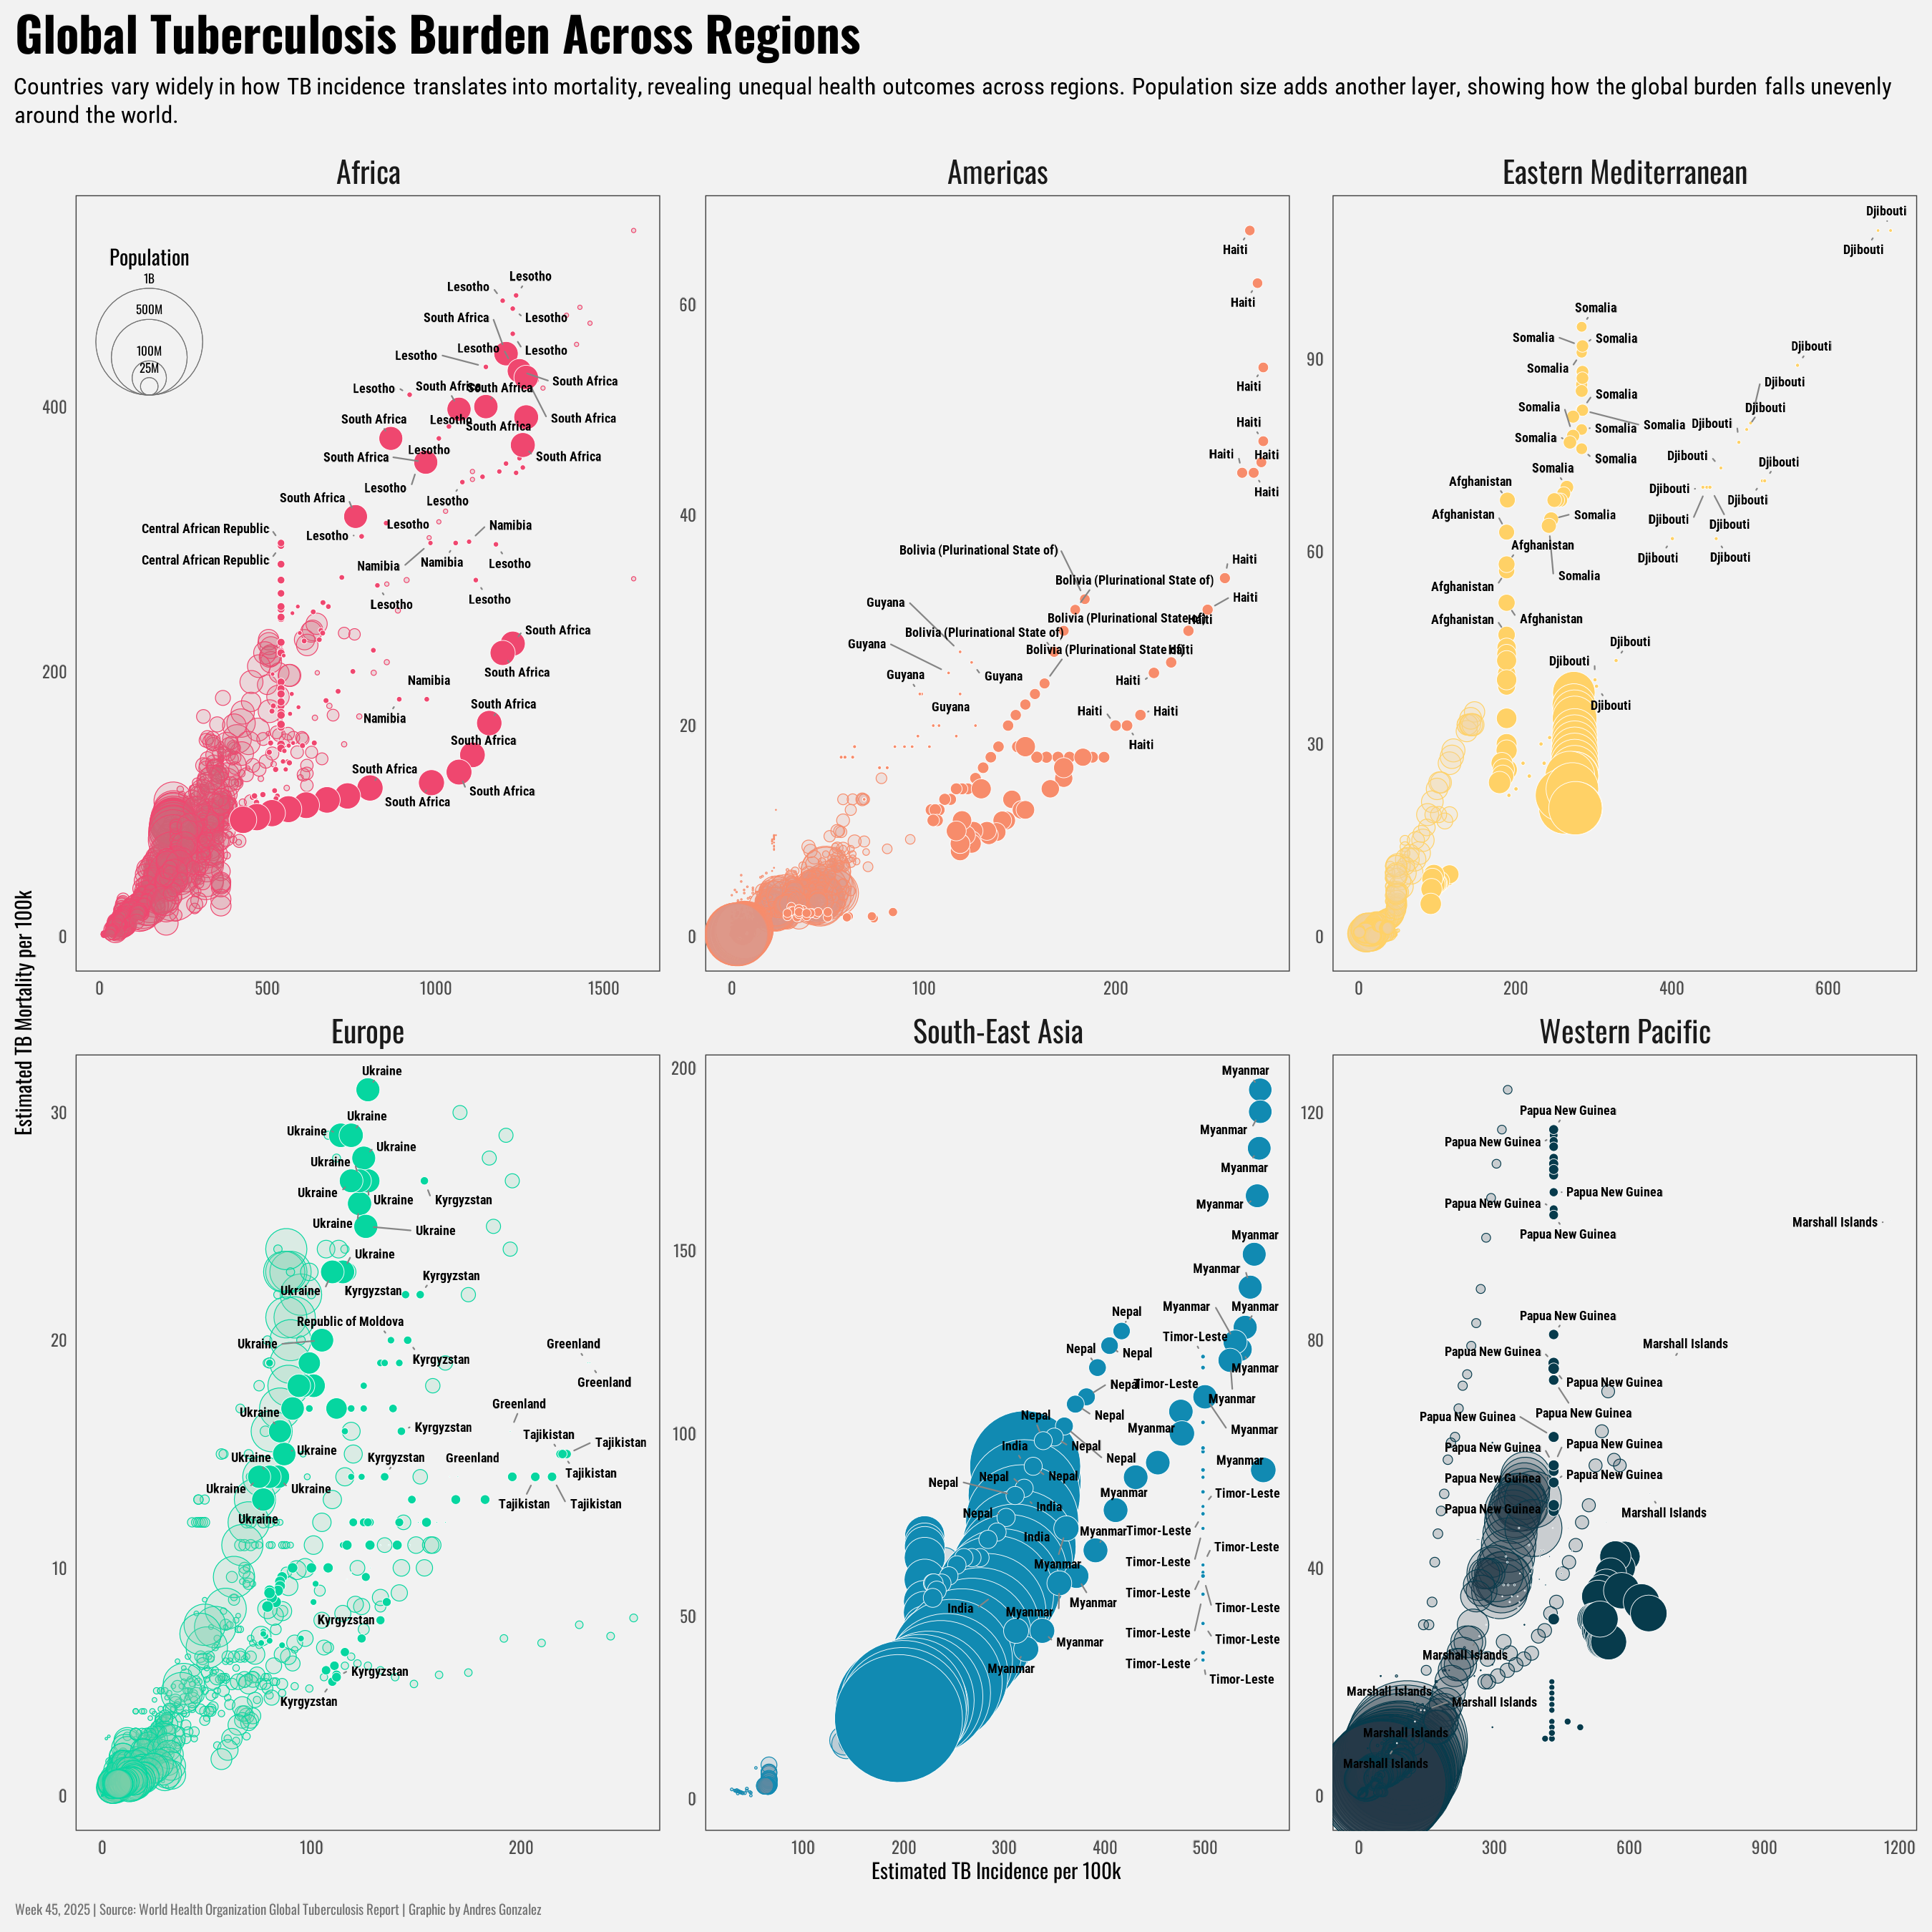
Andres Gonzalez
  • Blog
  • Visualization
  • Resume
  • Spotify

Year

  • 2025
  • 2024
Categories
All (9)
Crime Data (1)
Data Visualization (9)
Map (1)
NCAA (1)
R Programming (9)
Simpsons (1)
TidyTuesday (6)
Waffle (1)
gt (1)
sf (1)

Andresviz.log()

Welcome to Andresviz.log()! Here, I share my collection of data visualizations made with R, featuring TidyTuesday challenges and other interesting project!

2025

April 15, 2025

Base R Penguins

TidyTuesday
R Programming
Data Visualization

Visualizing penguin body mass distributions across species (Adelie, Chinstrap, Gentoo) and gender, using data collected from Antarctic islands between 2007-2009.

Base R Penguins

February 20, 2025

Agencies from the FBI Crime Data

TidyTuesday
R Programming
Data Visualization
Crime Data

This map shows the number of law enforcement agencies in California that report crime data to the FBI’s National Incident-Based Reporting System (NIBRS).

Agencies from the FBI Crime Data

February 12, 2025

The Simpsons Dataset

TidyTuesday
R Programming
Data Visualization
Simpsons

This visualization showcases IMDb ratings for The Simpsons episodes across multiple seasons, where color represents the rating (from 4.5 to 8.4) and dot size reflects the number of votes. Notably, Barthood (S27E09) holds the highest rating (8.4), while Lisa Goes Gaga (S23E22) is the lowest-rated episode (4.5) with the most votes.

The Simpsons Dataset

February 10, 2025

Big West FG Scorers

gt
R Programming
Data Visualization
NCAA

The top 10 most efficient scorers in the Big West Conference for the 2024-2025 season are ranked by field goal percentage (FG%), with a minimum of 150 field goal attempts (FGA). Player details include team logos, class year, height, total shot attempts, and FG%, with a gradient emphasizing shooting efficiency.

Big West FG Scorers

February 1, 2025

Water Insecurity

TidyTuesday
R Programming
Data Visualization

The tidycensus package in R is used to access and visualize U.S. Census data on social vulnerability indicators related to water insecurity in the Western U.S.

Water Insecurity

January 20, 2025

Damage Assessment From The Palisades Fire

R Programming
Data Visualization
Waffle

The damage levels caused by the Palisades Fire are shown across homes built in different decades, with 53.7% of damage assessments categorized as Destroyed (>50%) and 65.9% of homes from the 1970s sustaining No Damage.

Damage Assessment From The Palisades Fire

January 15, 2025

Pacific Palisades

Map
R Programming
Data Visualization
sf

A map of Pacific Palisades, California, showing streets, building footprints, and the Pacific Ocean in a minimalist blue-and-beige design.

Pacific Palisades
No matching items

2024

December 30, 2024

James Beard Foundation

TidyTuesday
R Programming
Data Visualization

The James Beard Foundation Awards are annual honors recognizing excellence in the culinary, hospitality, and food media industries across the United States.

James Beard Foundation

December 20, 2024

The Scent of Data

TidyTuesday
R Programming
Data Visualization

Perfume ratings have become more varied in recent decades, with the 2000s and 2010s displaying the widest range driven by diverse user opinions, while the highest ratings consistently reflect luxury brands.

The Scent of Data
No matching items

The blog post listing is based on the website source of Andrew Heiss, who has put together an incredible listing template under CC-BY-SA 4.0 license. Thank you!

Back to top

Do you enjoy my blog? Subscribe here to get notifications and updates (it's free!):

2024 Andres Gonzalez All content licensed under
Creative Commons CC BY 4.0


Made with and Quarto View the source at GitHub