How This Table Was Made
1. 📦 Load Packages & Setup
2. 📖 Read in the Data
df <- cbd_torvik_player_season(year = 2025, conf = "BW") # Get 2025 player stats for Big West Conference from Torvik databaseAPI Key set!3. 🕵️ Examine the Data
4. 🤼 Wrangle Data
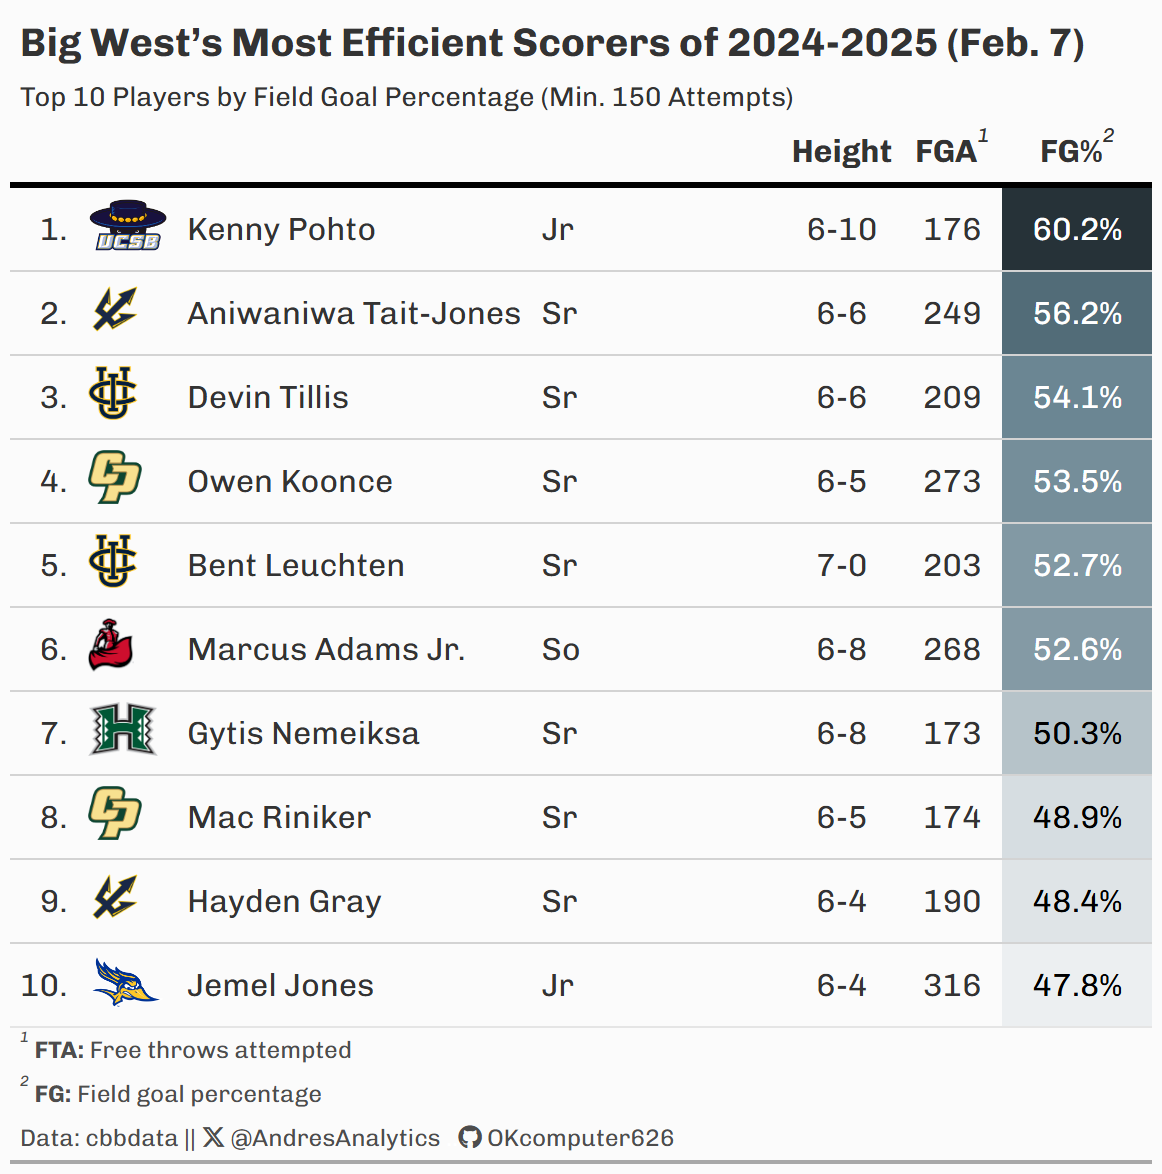
# Filter players with at least 150 FGA, select top 10 by FG%, add rank and logo path
df_cleaned <- df %>%
  filter(fga >= 150) %>%
  slice_max(fg_pct, n = 10, with_ties = FALSE) %>%
  mutate(rank = row_number(),
         logo = here::here(paste0("Data/NCAA Big West/", team, ".png"))) %>%
  relocate(rank) %>%
  select(rank, logo, player, exp, hgt, fga, fg_pct)
5. 📊 Table
# Create and format a gt table for the top 10 most efficient scorers in the Big West
t <- df_cleaned %>%
gt() %>%
tab_header(
title = md("**Big West's** Most Efficient Scorers of 2024-2025 (Feb. 7)"),
subtitle = "Top 10 Players by Field Goal Percentage (Min. 150 Attempts)"
) %>%
cols_label(
rank = "",
logo = "",
player = "",
exp = "",
hgt = md("**Height**"),
fga = md("**FGA**"),
fg_pct = md("**FG%**")
) %>%
fmt_integer(columns = rank, pattern = "{x}.") %>%
fmt_percent(columns = fg_pct, decimals = 1) %>%
gt_img_rows(columns = logo, img_source = "local", height = 27) %>%
gt_color_rows(columns = fg_pct, palette = "ggsci::blue_grey_material") %>%
opt_table_font(
font = google_font(name = "Chivo")
) %>%
cols_align(align = "center",
columns = hgt:fg_pct) %>%
tab_style(
style = cell_borders(
sides = "b",
color = "black",
weight = px(3)
),
locations = cells_column_labels()
) %>%
tab_style(
style = list(
cell_text(weight = "bold")
),
locations = cells_title(groups = "title")
) %>%
tab_source_note(source_note = md(
paste0(
"Data: cbbdata || ", "<span style='font-family: \"Font Awesome 6 Brands\";'></span> ",
"@AndresAnalytics ",
"<span style='color: white;'>..</span>",
"<span style='font-family: \"Font Awesome 6 Brands\";'></span> ",
"OKcomputer626"
)
)
) %>%
tab_style(
style = cell_text(
color = "gray30", size = px(12)
),
locations = cells_source_notes()
) %>%
tab_footnote(
footnote = md("**FTA:** Free throws attempted"),
locations = cells_column_labels(columns = fga)
) %>%
tab_footnote(
footnote = md("**FG:** Field goal percentage"),
locations = cells_column_labels(columns = fg_pct)
) %>%
tab_style(
style = cell_text(
color = "gray30", size = px(12)
),
locations = cells_footnotes()
) %>%
cols_width(
exp ~ px(125),
hgt ~ px(50),
fga ~ px(50),
fg_pct ~ px(75)
) %>%
tab_options(table_body.border.bottom.width = '1px',
table_body.border.bottom.color = "gray90",
data_row.padding = '5px',
table.background.color = "#FBFBFB",
heading.align = "left",
table.border.top.style = "hidden",
column_labels.border.top.style = "hidden")6. 💾 Save
# Save the formatted gt table as an image with cropped whitespace
gt_save_crop(data = t, "Big West FG Scorers Feb 8th.png", whitespace = 10, bg = "#FBFBFB")
8. 🚀 GitHub Repository
TipExpand for GitHub Repo
The complete code for this analysis is available in Big West FG Scorers Feb 8th.qmd.
For the full repository, click here.
Citation
For attribution, please cite this work as:
Gonzalez, Andres. 2025. “Big West FG Scorers.” February 10,
2025. https://andresgonzalezstats.com/visualization/Visualizations/2025/Big
West FG Scorers Feb 8th.html.